Every business owner wants to maximize their efficiency. The first step in improving is pinpointing problem areas or areas for potential growth. FlexiBake can help you identify these areas with a number of analysis tools based off of your company's activity in the program.
One such tool is the Expected vs. Actual Production Times analysis. Here you can see how your production staff are performing in terms of time efficiency. It could help you recognize areas where more training is needed, where equipment could be improved or repaired, or which recipes aren't being prepared as efficiently as others.
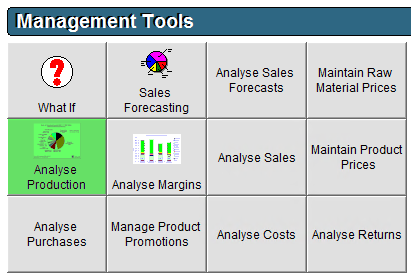
- In the Management Centre, click on Analyse Production.
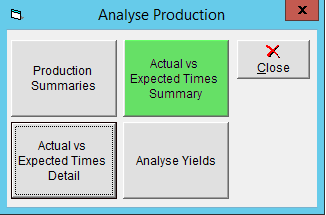
- A dialogue box will pop up. Select Actual vs. Expected Times Summary.
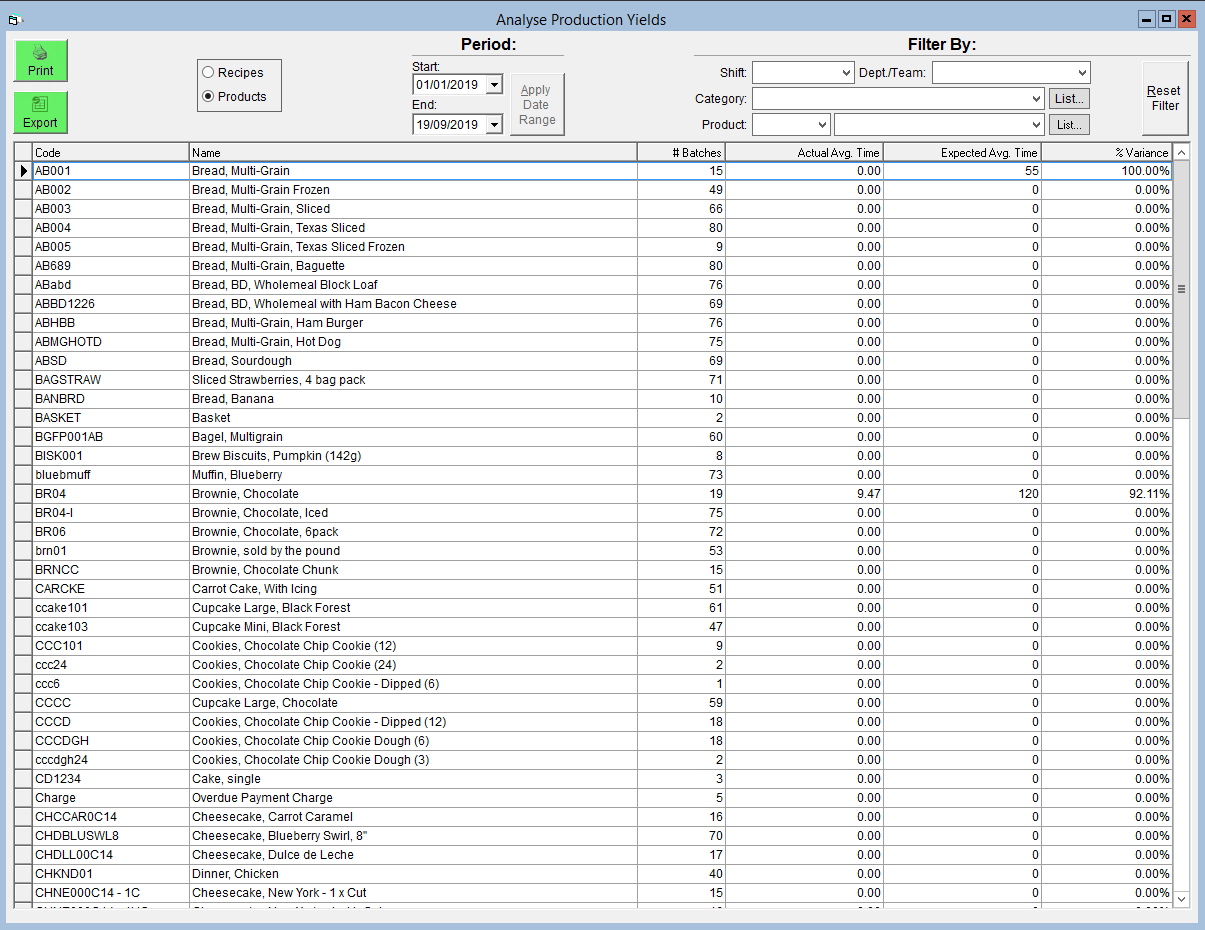
- Select whether you would like to look at products or recipes.
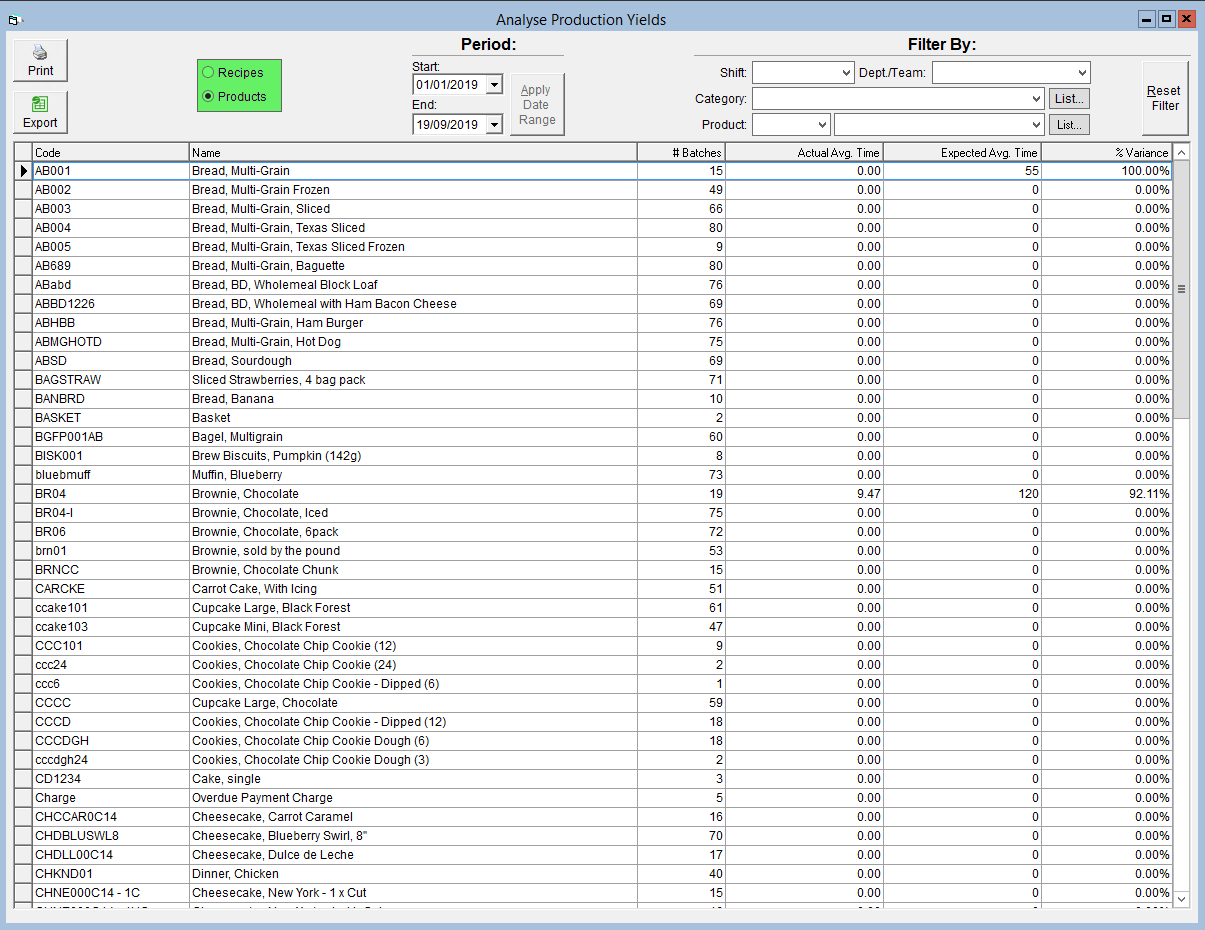
- You can use the following filters to help find what you're looking for in the grid below:
- Period - You can choose Start and End dates using the drop-down calendars. Clicking Apply Date Range will display the results for that time period. You can use this to compare trends week-to-week, month-to-month, etc.
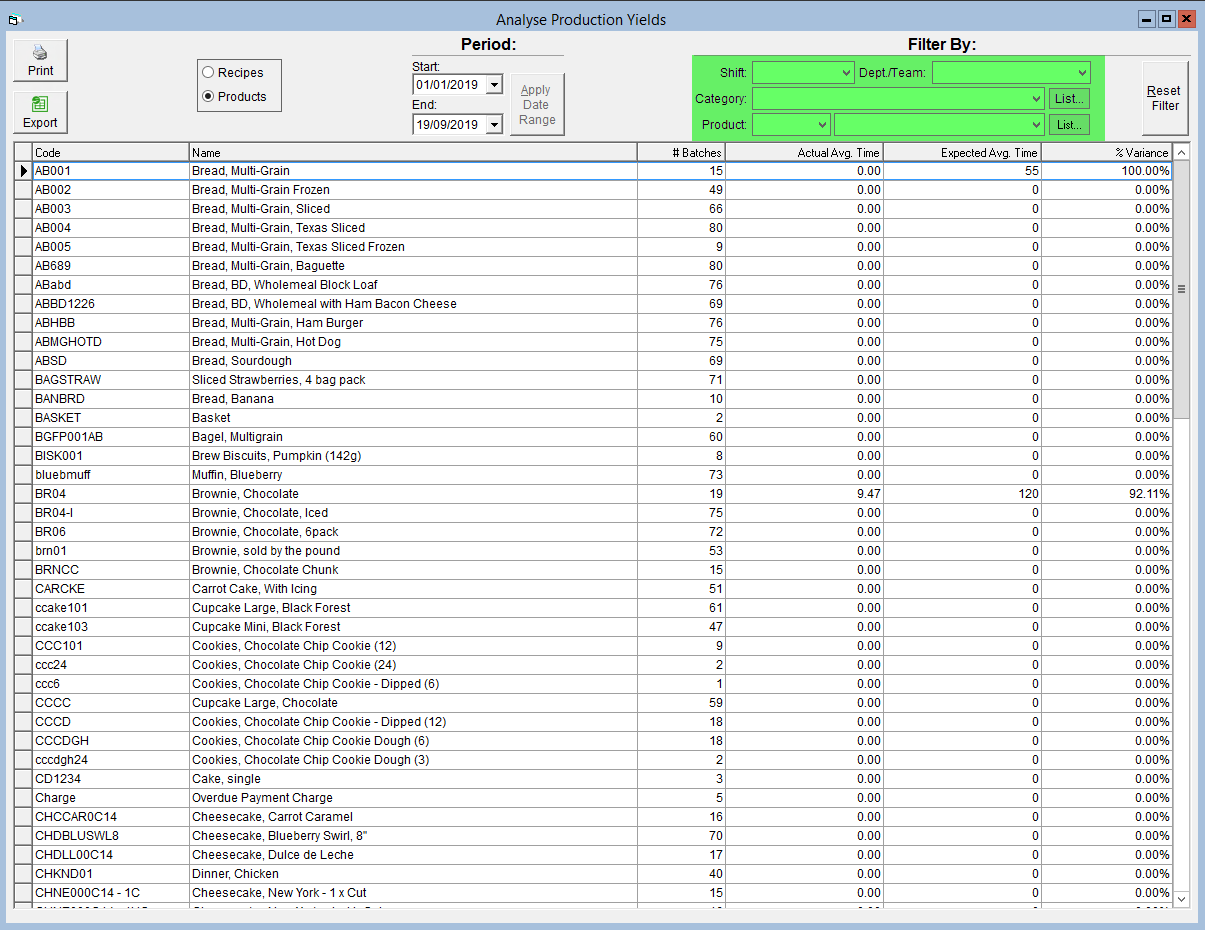
- Shift - If you assign production to shifts, you can select a shift from this drop-down to see production time records for items completed by that shift. For more information on shifts, see Add or Edit Production Shifts.
- Dept/Team - If you have your product or recipe categories assigned to production departments, you can select the department from the drop-down to see production time records for items completed by the selected department. More information on departments can be found in Maintain Production Departments.
- Category - Select a product category to see the production time analysis for all items in that category.
- Product/Recipe - Select a specific product/recipe from the drop-down to see the production time analysis for that product/recipe only.
When switching between filters, click the Reset Filter button to remove all filters and start fresh.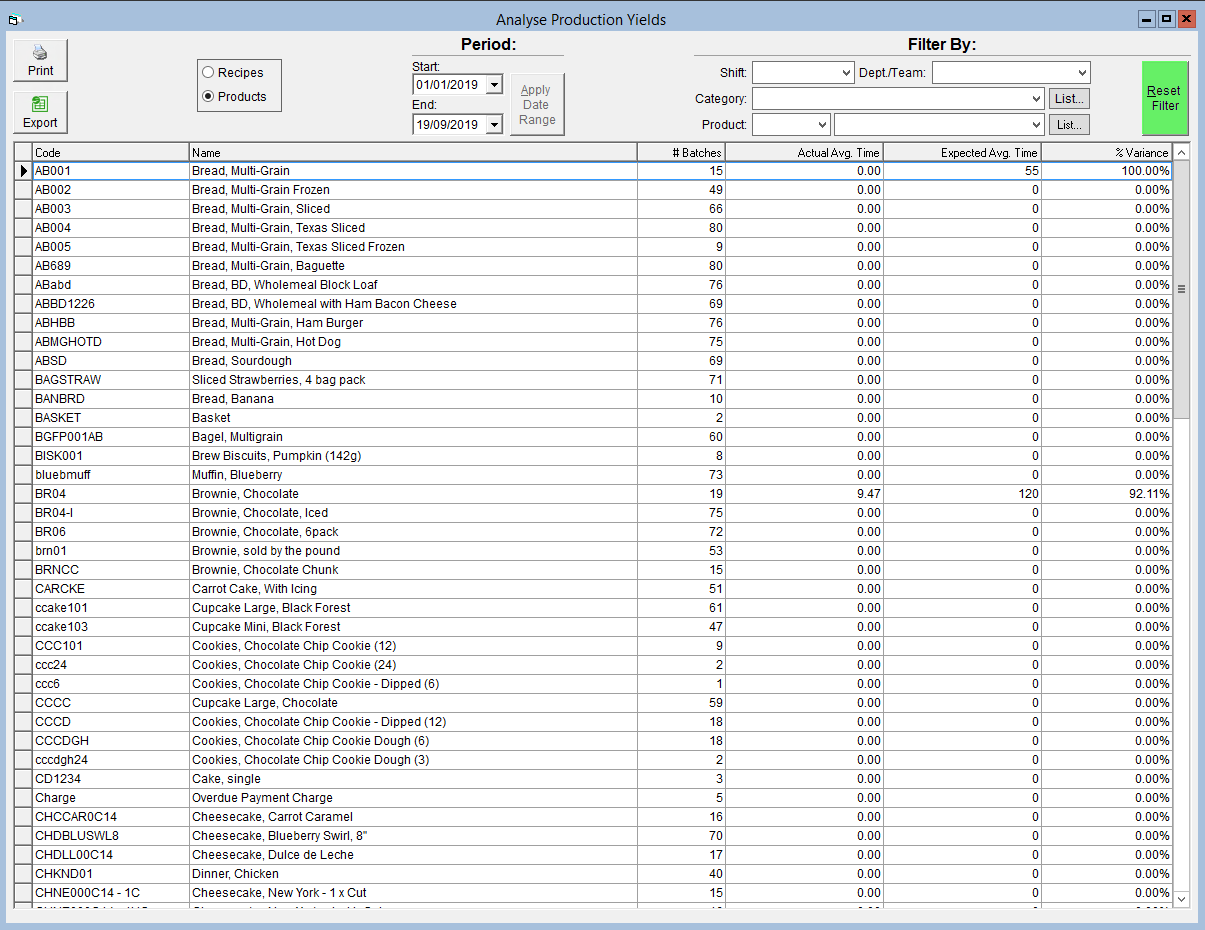
- Period - You can choose Start and End dates using the drop-down calendars. Clicking Apply Date Range will display the results for that time period. You can use this to compare trends week-to-week, month-to-month, etc.
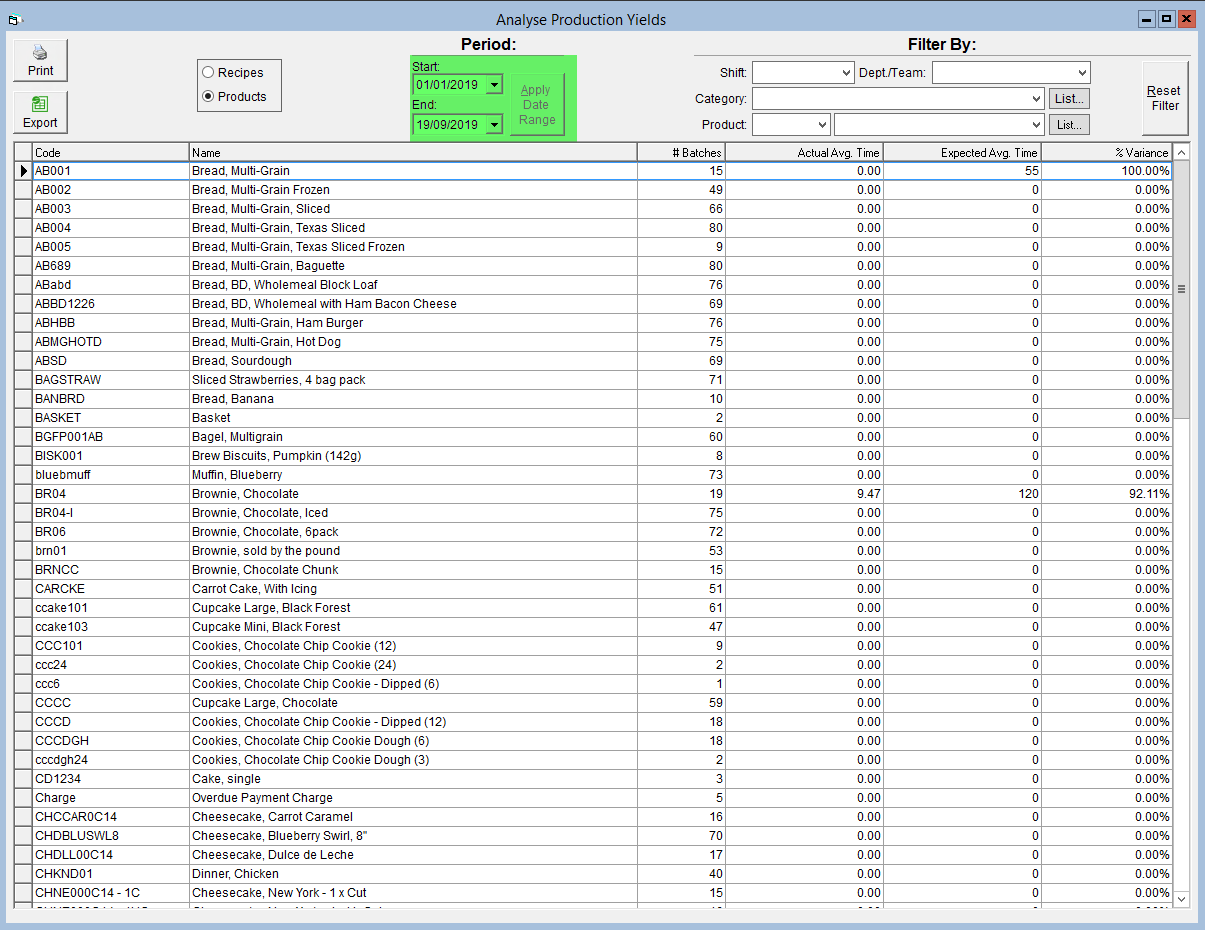
- The Production Yield Grid below displays the following information:
- Code - The code associated with the recipe or product.
- Name - The name of the recipe or product.
- # Batches - The number of batches produced over the course of the selected time period.
- Actual Avg Time - The average of the recorded production times for that recipe.
- Expected Avg Time - The batch time associated with that recipe or product. Please see for more information.
- % Variance - The percentage difference between your actual and expected average times. A positive percentage indicates that your actual time is lower than the expected time, while a negative indicates that it is greater.
- Everything in the grid can be printed by clicking on the Print button, or exported to an Excel/Open Office spreadsheet by clicking on the Export button. Both are located in the upper left.