This report shows you a graph of the different customer categories. You are able to set different date periods or date ranges.
To find this report:
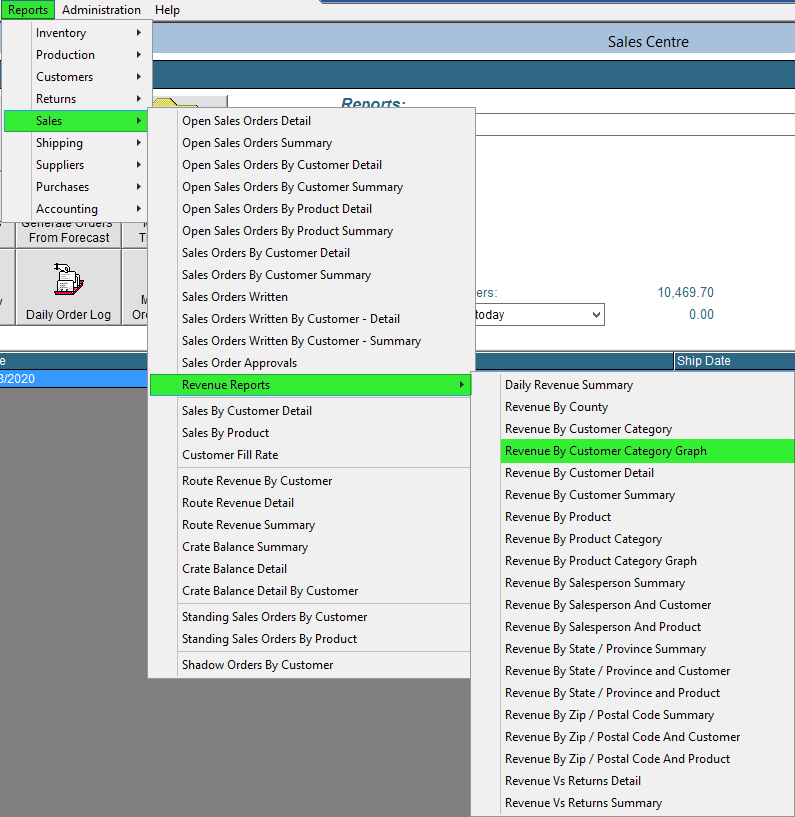
- In the Drop Down Menu click Reports, then select Sales, then press Revenue Reports and lastly click Revenue by Customer Category Graph
- A report will pop-up, you can select a Period or you can choose from two Dates. Once you click Refresh it will show you the reports from the dates chosen. From this print preview you can save or print in the top left, or email the report directly from FlexiBake in the top right using the Email Report button.
