
How is data captured?
Sales Analysis uses completed invoice records from the date range you select, along with any related specified credits. This helps ensure the results reflect finalized sales activity for that period.
Sales Analysis totals may differ from your revenue totals depending on view and comparison report. This is because charges like freight, tax, and order-level discounts are not included in this analysis.
Before you begin
- Confirm the user has permissions to access the Analysis Centre.
- Decide which type of sales data you want to review before generating the results.
- Ensure all related data for the period is completed and generated for best results.
Note: The Analysis Options display data like a report but can be refactored or filtered, they offer more control over how the information is presented.
Open the Sales Analysis tool
Step 1
Open the Analysis Centre and Click Analyse Sales to open the Sales Analysis sub-selection menu.
Step 2
Review the available analysis options in the window. Select the analysis option you want to use, such as By Product or By Customer.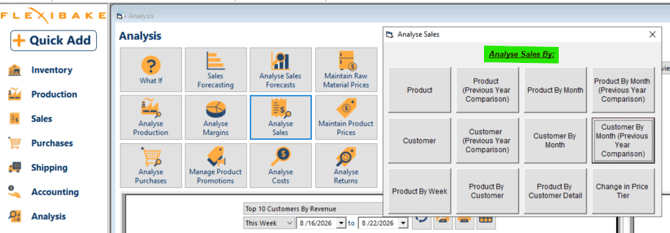
Generate sales data for a date range
Step 1
Choose a Period or enter the required From and To dates to define the sales data you want to review.
Step 2
Click Apply Date Range to generate the results. The Analysis type selected in the previous stage will define how the information is displayed in the grid.
Tip: Use a wider date range first, then narrow the results with date adjustments and filters once the data is on screen.
Filter the sales data
Step 1
Use the filter drop-downs to narrow the data. Depending on the Sales Analysis option you selected, you can filter by Product, Product Category, Customer, Customer Category, and, in certain subsets, Warehouse or Route.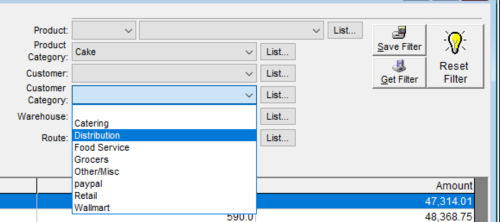
Step 2
If you need to include more than one value from the same filter, click the List button beside that filter and select the items you want to include. Click OK to apply the list filter.
Step 3
The data below will filter automatically as you select different filters or options, changes to the date range must be re-captured through Apply Date Range.
Tip: If you already have a saved filter, click Get Filter to load it instead of selecting the filter options again. Get Filter only loads an existing saved filter.
Save a filter for reuse
Step 1
Set the date range and choose the filter options you want to use.
Step 2
If needed, use the filter drop-downs or List buttons to refine the analysis until the results show the exact data you want to reuse later.
Step 3
Click Save Filter once you are happy with the selected options. Enter a name for the filter, then click OK to save it.
Note: You may enter a Category for the Filter, these are helpful to distinguish between tasks or facilities.
Step 4
To use the filter later, click Get Filter and select the saved filter from the list. If needed, you can adjust the loaded filter and save it again as an updated or separate filter.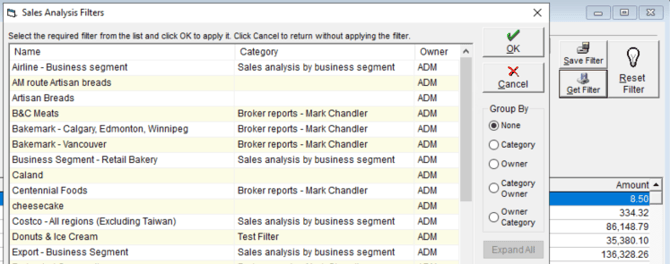
Note: Saved filters are available within the Analyse Sales tool and can be reused in other analysis views inside that same tool.
Common ways to use related sales views
By Product option
Step 1
Select By Product when you want to review sales data grouped by product.
Step 2
Select a date range, apply the filters you need, or load an existing saved filter.
Step 3
Review the results to identify which products are performing well, which products are slowing down, and which items may need closer review.
Best for: Product performance reviews, comparing demand across products, and spotting sales trends over time.
By Customer option
Step 1
Select By Customer when you want to review sales data grouped by customer.
Step 2
Select a date range, apply the filters you need, or load an existing saved filter.
Step 3
Review the results to compare customer activity, identify top accounts, and spot changes in purchasing behavior.
Best for: Customer trend reviews, account planning, and identifying high-value or low-activity customers.
Product by Customer
Step 1
Use Product by Customer when you want to see which customers purchased specific products.
Step 2
Review the results by product first, then compare the customer activity attached to each item.
Best for: Understanding which customers buy each product and identifying customer demand by item.
Product by Customer Detail
Step 1
Use Product by Customer Detail when you need a more detailed version of the customer and product relationship.
Step 2
Review the line-level detail to investigate product mix, customer buying patterns, or changes across a selected date range.
Best for: Detailed account reviews, sales investigations, and validating what was sold to each customer.
Product by Month
Step 1
Use Product by Month when you want to compare product activity across multiple months.
Step 2
Generate the data over a longer period so month-over-month patterns are easier to review.
Step 3
Use the output to identify seasonal trends, recurring peaks, or declining demand.
Best for: Trend analysis, seasonal planning, and reviewing product performance over time.
Warning: Sales Analysis pulls data directly from FlexiBake records. If records in the selected date range are unfinished or have been reversed, they will not be included in the results. Complete all related records before capturing data for that period.